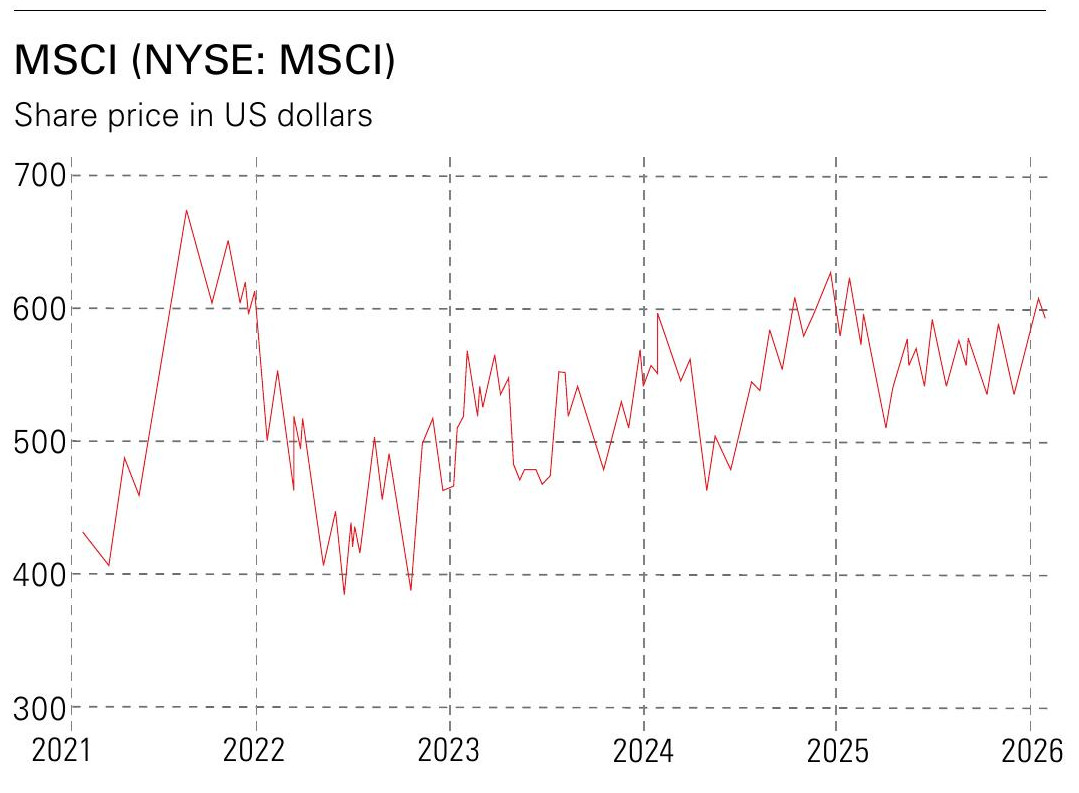
Unlock Profits with MSCI, Finance’s Core Index Leader
The inaugural stock market index, known as the Dow Jones Transportation Average, emerged in 1884 under the guidance of Charles Dow. This index initially tracked a modest group of just 11 companies. At the time, Dow could not have foreseen that his innovation would evolve into the foundational pillar supporting the entire global investment landscape.
Pioneers like Dow aimed to demystify the turbulent fluctuations of Wall Street and London’s financial district, rendering them accessible to everyday individuals. In the present day, these indexes wield immense influence over the investment sphere. Vast sums, amounting to tens of trillions of dollars, are measured against prominent indexes. Each quarter, investment professionals worldwide disclose their performance metrics, rigorously evaluating themselves relative to these essential financial yardsticks.
MSCI stands among the primary index providers
The index provision landscape is dominated by three key players: S&P Dow Jones, FTSE Russell, and MSCI. Each entity brings distinct advantages and limitations, with varying levels of recognition in specific regions. For instance, UK investors are particularly familiar with the FTSE 100, which is overseen and owned by FTSE Russell—a subsidiary of LSEG, the entity behind the London Stock Exchange. S&P Dow Jones oversees the primary US benchmarks, including the S&P 500 and the Dow Jones Industrial Average. Meanwhile, MSCI curates the premier global equity benchmarks.
These organizations supply critical benchmarking information to fund managers across the industry. When giants like BlackRock’s iShares or Vanguard introduce a new fund, they enter into licensing agreements with the relevant index provider. The provider meticulously monitors every dollar invested in the fund to determine the appropriate licensing fees, while simultaneously delivering real-time updates on index modifications. Although fund managers could theoretically handle this internally, outsourcing to a neutral third party eliminates potential biases and enables straightforward performance comparisons among various providers.
MSCI’s crown jewel is its MSCI World index, encompassing the 23 largest and most influential developed equity markets worldwide. This comprehensive index includes 1,320 components, representing approximately 85% of the global equity market capitalization. The sheer breadth and depth of this benchmark have elevated MSCI to a position of unparalleled prominence among index providers. Recent financial disclosures from the company indicate that roughly $18.3 trillion in assets are benchmarked to its equity indexes. This figure breaks down to $12 trillion in passive indexed products and $6.3 trillion in actively managed portfolios. Additionally, a record-breaking $2.2 trillion is tied specifically to exchange-traded funds (ETFs) linked to MSCI’s indexes.
The extensive influence of MSCI means that its endorsements or exclusions can dramatically sway the fortunes of companies and even entire nations. For example, in late January, stocks on Indonesia’s Jakarta Composite index experienced an 8% drop in a single trading session following MSCI’s cautionary note about declining liquidity, which threatened the country’s status in the flagship emerging-markets index.
MSCI operates as a highly profitable powerhouse
MSCI’s operations are structured around four core business segments. The index division serves as the flagship, generating income primarily through recurring subscriptions and asset-based fees associated with products like ETFs and open-ended unit trusts. Complementing this is the analytics segment, which offers sophisticated tools for portfolio management and risk assessment. The sustainability unit delivers vital data and ratings, empowering investors to navigate evolving environmental and social challenges; this area intersects with the index business, as these ratings facilitate benchmarking against eco-focused indexes. Rounding out the portfolio is the private assets division, which furnishes performance analytics for private equity and real estate investment managers.
Nearly all of MSCI’s revenue streams from subscription models, encompassing both fixed-fee arrangements and asset-linked fees that asset managers are compelled to pay for ongoing access to proprietary data and benchmark usage rights. This structure embodies an ideal business paradigm: the sector is effectively an oligopoly controlled by three dominant firms, revenues are predictably recurring, and the ongoing development and upkeep of indexes incur negligible additional costs.
During the fourth quarter of 2025, MSCI achieved a 9.4% increase in subscription run-rate growth within its index segment, with the custom index unit posting a robust 16% year-over-year expansion. Analysts from UBS project that overall growth could rebound to double-digit levels in 2026, fueled by surging interest in global passive investment vehicles and the persistent expansion of private markets. Asset-based fees, predominantly from ETFs, surged 21% year-on-year in that quarter, while private markets revenue climbed 7%.
Leadership at MSCI is prioritizing cost efficiencies, harnessing artificial intelligence to streamline operations and capitalizing on economies of scale. According to UBS estimates, the company’s EBITDA margin is poised to widen by 170 basis points in fiscal 2026, reaching 62.5%, followed by an additional 60 basis points in the subsequent year to 63.2%. Such elevated margins underscore MSCI’s identity as a data-centric enterprise, benefiting from massive scale advantages, steep customer switching costs, and enduring contractual commitments. Notably, the company recently prolonged its alliance with BlackRock through 2035.
UBS forecasts net income of $1.5 billion for fiscal 2026, an improvement from $1.3 billion in 2025. As the worldwide asset management sector burgeons, this figure could escalate to $2.4 billion by 2030. Even with this promising trajectory, MSCI’s stock trades at a forward multiple of just 26 times projected 2027 earnings—well below its five-year historical average of 40 times. Relative to the broader S&P 500, it is positioned one standard deviation under its long-term valuation norms. This valuation appears attractively undervalued given the company’s commanding global position.